Press Room
Original UK vehicle data, free to cite
We run manufacturer service-history and DVSA MOT lookups for UK car buyers and motor traders, and we publish what the aggregate data shows. Every figure below is free to use with attribution to findservicehistory.com. The full methodology and sample size are on this page — nothing is behind a form.
Media contact
George Arnold
Founder & Vehicle Data Expert, FindServiceHistory
research@findservicehistory.com
Available for interview and comment. We can run bespoke cuts of this dataset — by manufacturer, vehicle age or fuel type — usually the same day. There is no regional breakdown: we do not store postcodes.
The figures
From 3,626 UK vehicle lookups, August 2024 – August 2026. Last regenerated 21 August 2026.
How to quote this accurately
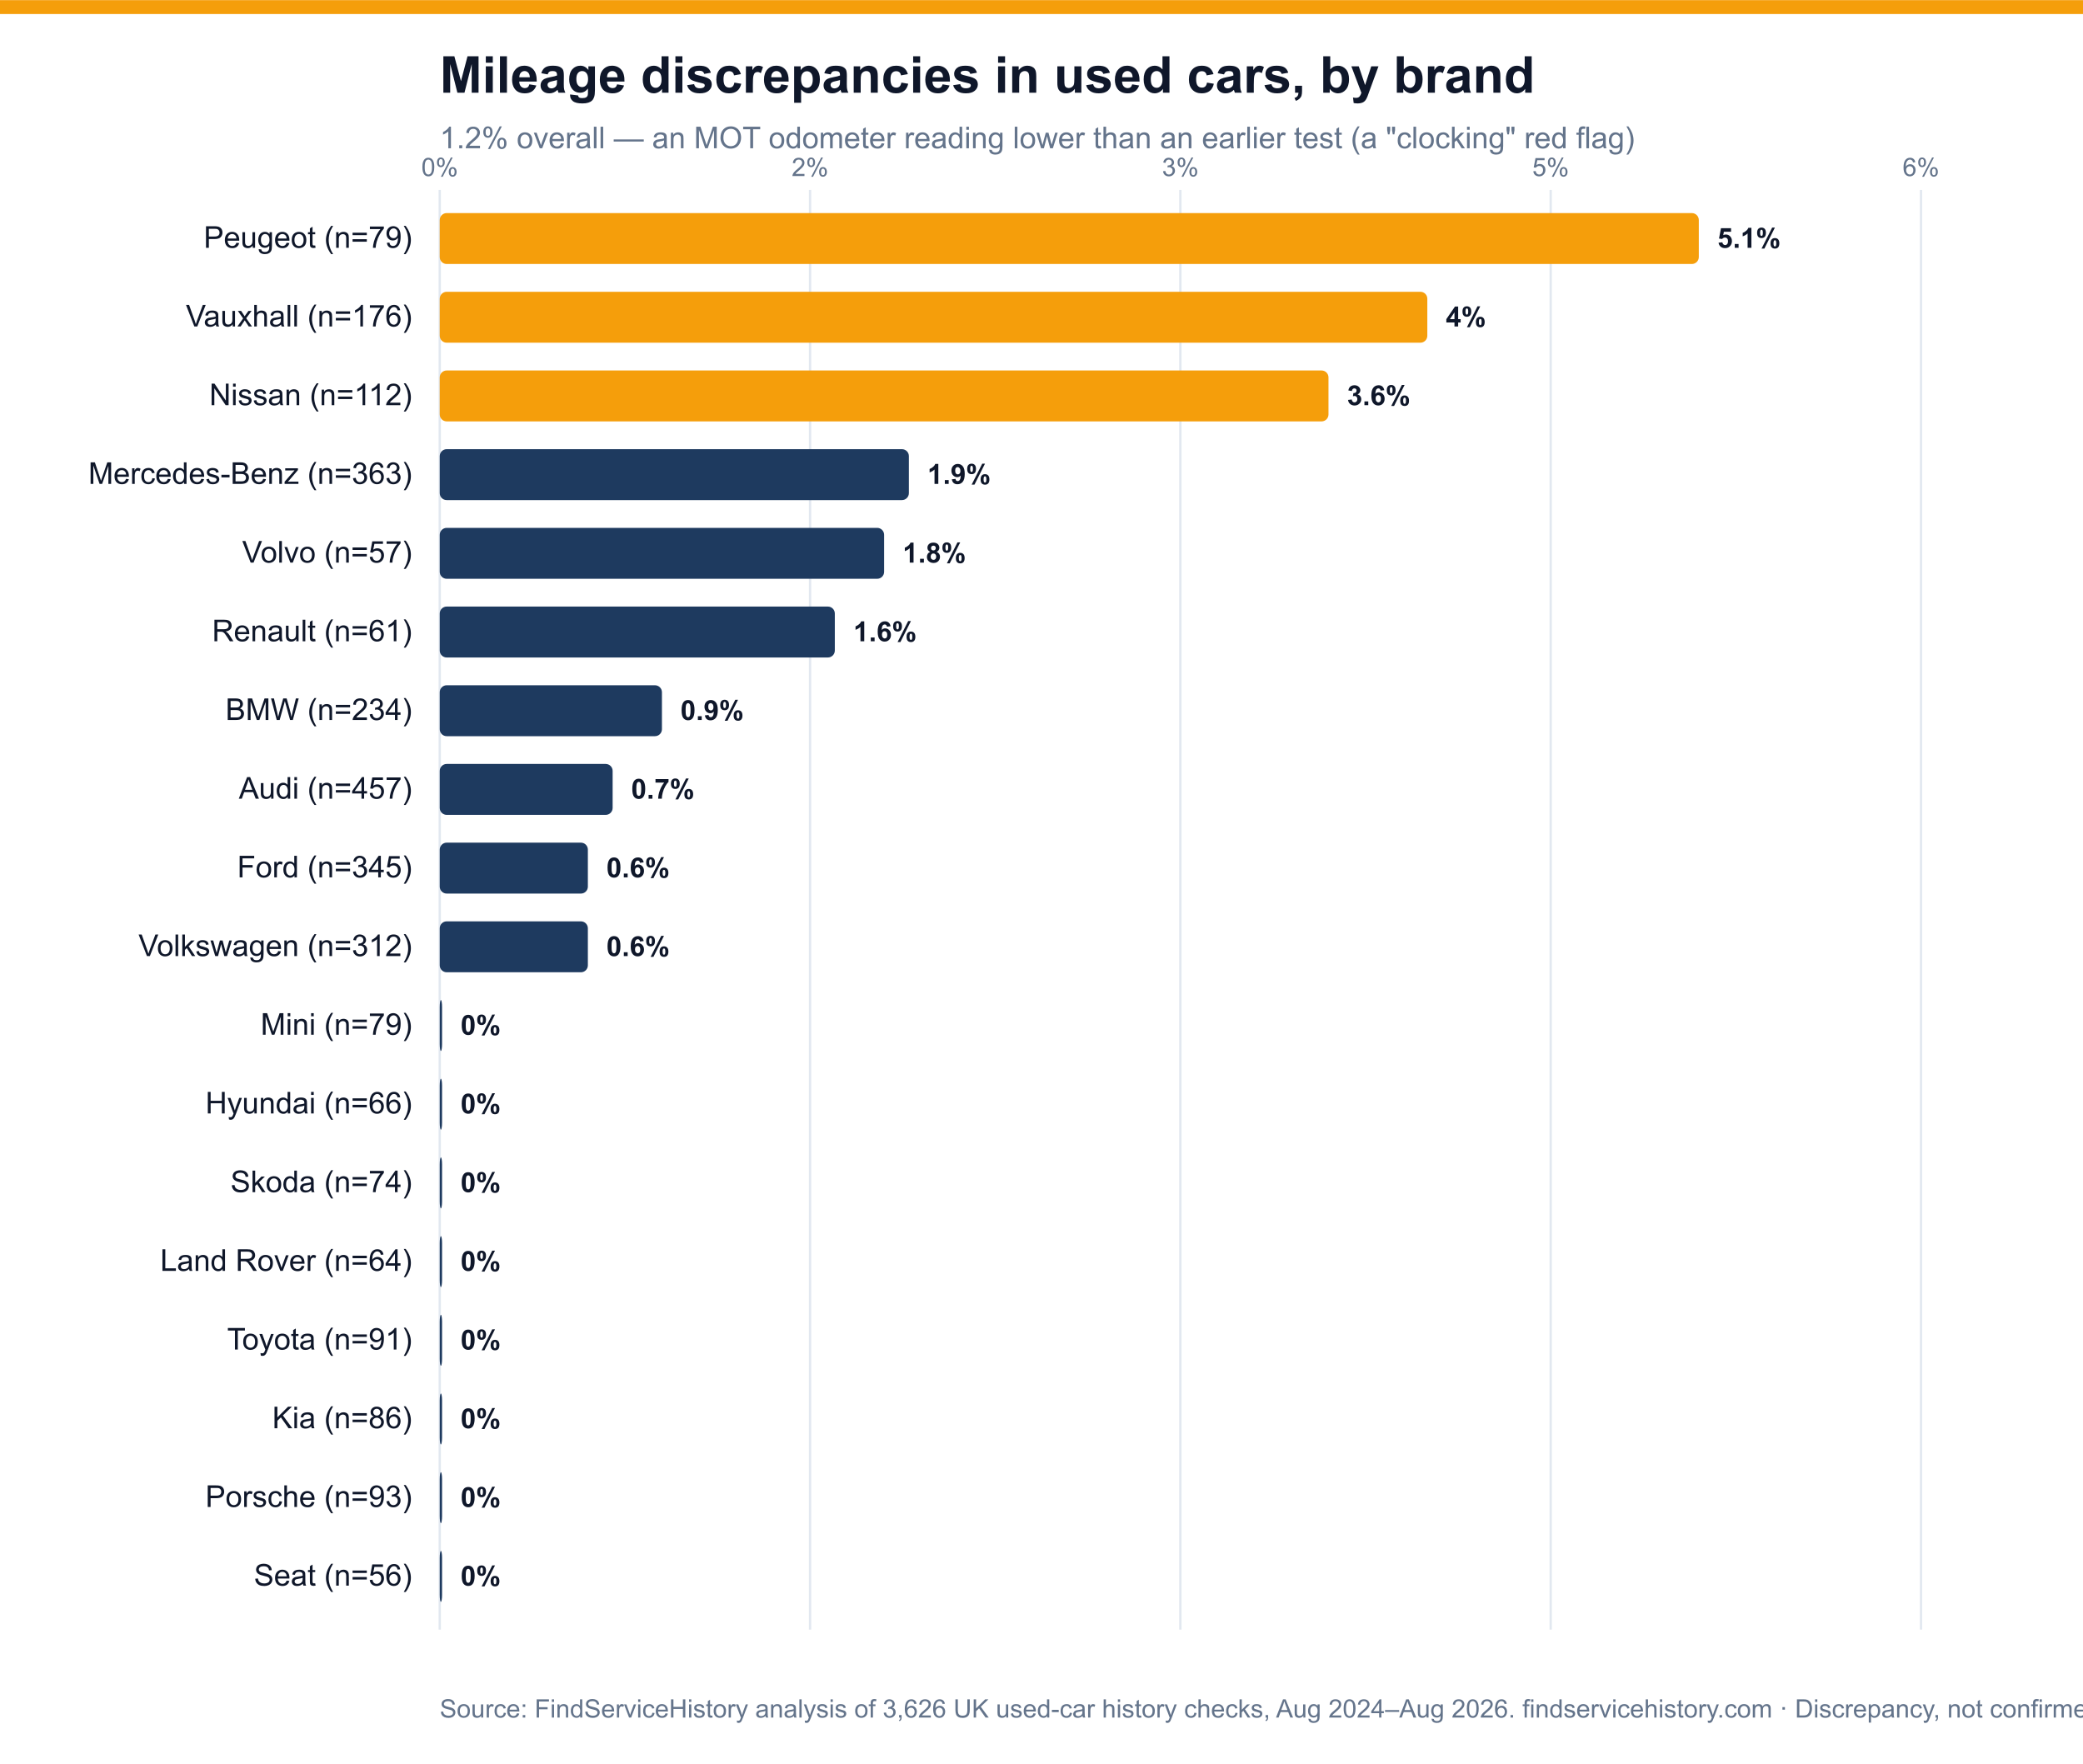
The mileage figure is a range, not a single number. We have measured it three times on successively larger samples and returned 1.4%, 1.4% and 1.2%. The defensible statement is "between 1 in 70 and 1 in 80". That stability across three runs is itself the finding.
It is a discrepancy, not proven fraud. A replaced instrument cluster produces the same signature, which is why we set a 1,000-mile threshold and report an anomaly. Please write "mileage discrepancy" or "odometer anomaly".
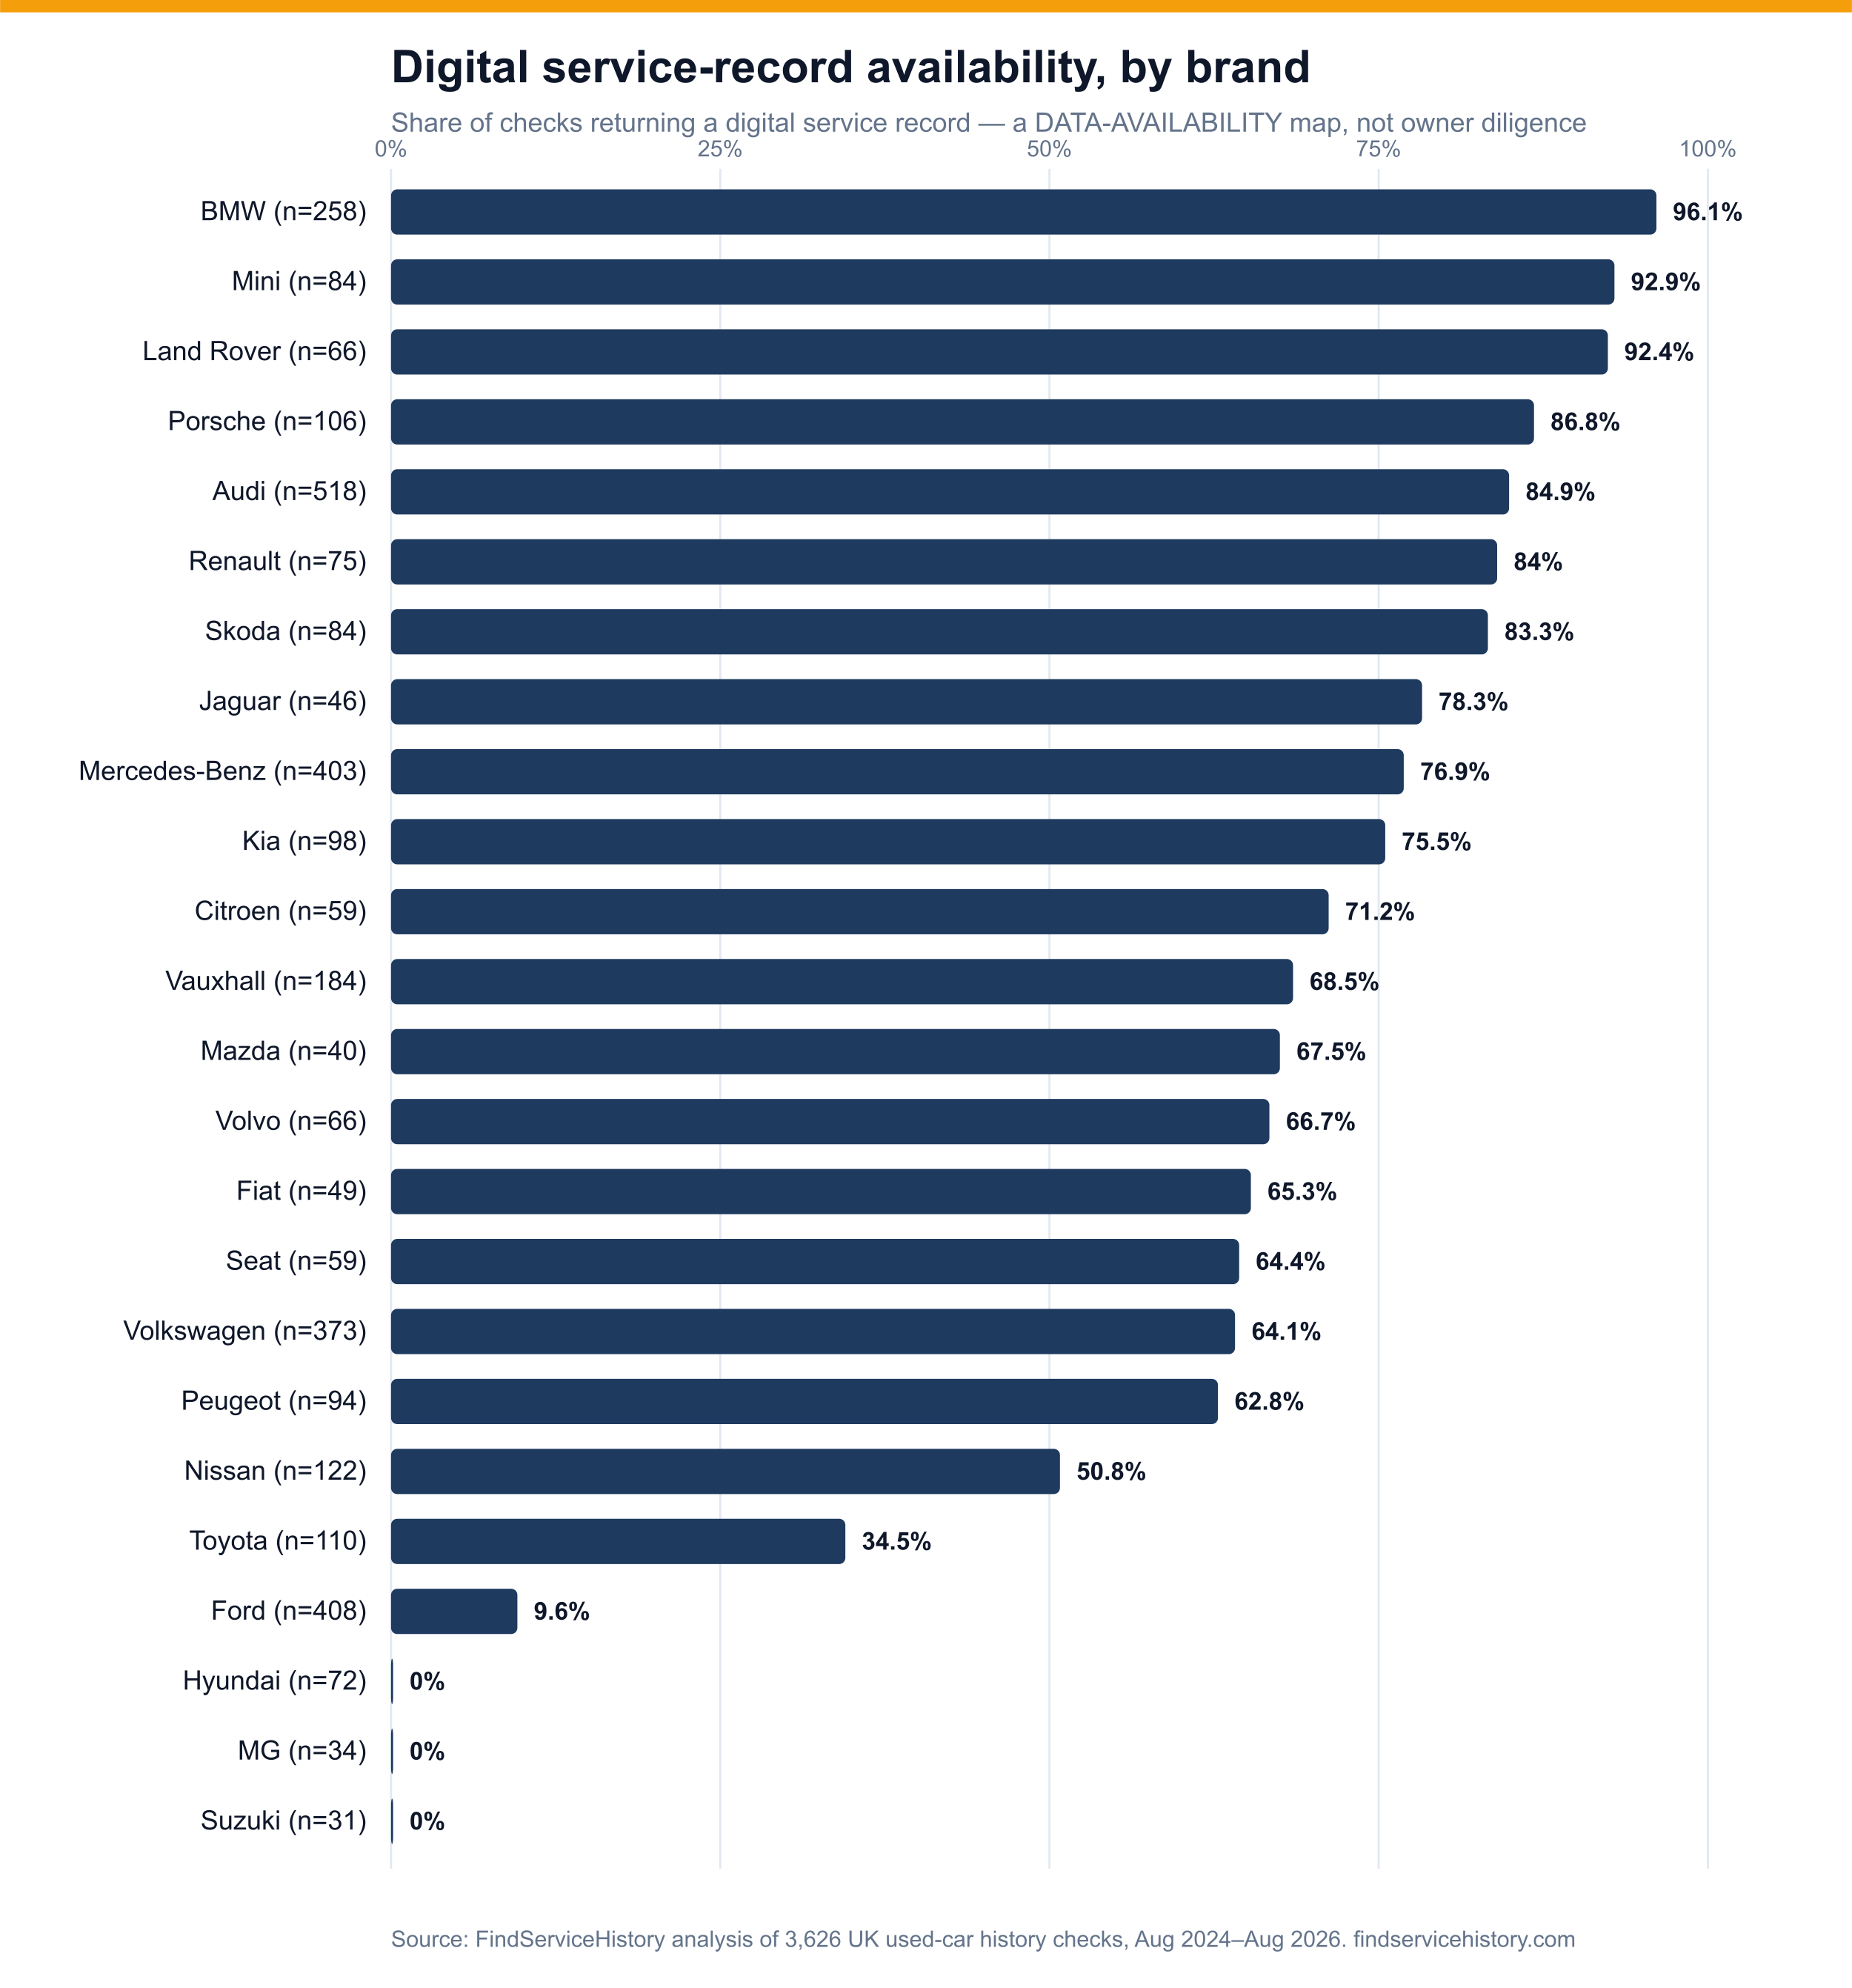
Brand coverage measures data availability, not owner diligence. A car serviced faithfully at an independent garage for ten years returns nothing on a manufacturer lookup. Please do not frame the brand table as a league table of how well owners look after their cars.
Attribution line
Paste-ready:
Methodology
Sample
- 3,626 used-car history checks run through FindServiceHistory.
- A rolling two-year window: August 2024 – August 2026.
- United Kingdom only. Included where the DVLA vehicle identity was confirmed. Both delivered reports and "no charge taken" results are counted — a lookup that found nothing is a genuine data point, not a failure.
- 12,917 individual dated workshop entries and 20,194 MOT test records analysed.
What "no service history" means
Coverage is the share of lookups where the manufacturer's digital service record returned at least one logged entry. "No history" therefore means no digital record was retrievable — not that the car was never serviced. Some cars have a paper book only, and a great deal of UK servicing happens at independent garages whose records never reach the manufacturer's central system.
Why a low hit rate is not a broken data feed
Our data source contracts each manufacturer at one of three tiers, and they measure different things:
- Full — "we expect to receive data on any recorded services"
- Limited — "data in a minimal proportion of cases"
- Workshop remarks — recalls and warranty work only; services are not included
These are three dimensions, not one scale, so a brand's hit rate is a property of the population being looked up rather than a measure of its feed. Three brands returned zero across their entire sample and are not contracted to return services at all — Hyundai, Suzuki and MG, 137 cars between them. Excluding those, the headline moves from 36.5% to 34.0%. We lead with the all-brands figure because it is what a buyer actually experiences when they run a check. We do not exclude brands merely for a low hit rate: that would condition the result on the outcome and would inflate the headline by around twelve points.
On Ford, and on fleet vehicles
Ford is contracted at full tier and returns 9.6%, which makes it the obvious question. The intuitive explanation — that fleet and lease vans are serviced outside the franchised network — was tested and does not hold for Ford: its commercial models return 10.9% against 7.8% for its passenger cars, so passenger is the lower of the two. Every other brand's commercial vehicles return normally (Vauxhall 54.5%, Volkswagen 71.9%, Renault 80.0%). Where the fleet effect is visible is Mercedes-Benz: 35.3% on Sprinter, Vito and Citan against 79.4% on its cars. We do not yet have a supported explanation for Ford and will not offer one.
Mileage-discrepancy definition
- A vehicle is flagged when an MOT odometer reading dropped by more than 1,000 miles against an earlier test for the same vehicle, after normalising every reading to miles (the DVSA records some tests in kilometres).
- Evaluated on the 3,176 vehicles in the sample with two or more valid odometer readings.
- A conservative floor. A rollback done between MOTs, or below the 1,000-mile threshold, is invisible to this method, so the true rate is higher than reported.
A correction we applied to ourselves
For three days in July 2026 our service-history data provider stopped answering queries, and 85 lookups were recorded as "no records" when no successful query had in fact been made. All 85 were re-run: 46 did have service history and are counted as such, 20 were confirmed genuinely empty, and the 19 that could not be re-verified were excluded from the sample entirely rather than guessed at. Left uncorrected, a supplier outage would have been reported as an absence of service records, overstating the headline by roughly 1.5 percentage points.
Thresholds and reproducibility
- Brand coverage is published only where a manufacturer had 30 or more lookups (24 brands qualify). MOT rankings need 50 or more tests (32 brands). Service intervals need 30 or more measurable gaps between consecutive confirmed services (12 brands). Mileage-anomaly brand cuts need 50 or more vehicles with two-plus readings.
- No personal data is used or published — the pipeline outputs counts, rates and buckets only. No vehicle, owner or registration is identifiable in any figure.
- Every figure is produced by a single automated aggregate query over anonymised records, re-runnable on demand for verification.
- This is a rolling window, so figures move between updates. Always quote a number together with its sample size and date.
Assets
Free to publish alongside any story using this data.


About FindServiceHistory
Boilerplate paragraph for the end of a piece:
FindServiceHistory is based in Bath, United Kingdom.