UK Car Recalls 2010–2025: Software Now Behind 1 in 8
Analysis of 4,766 DVSA recalls: software causes 1 in 8 car recalls since 2020, up from 1 in 35, and a quarter are now fixed with a software update.
George Arnold · Founder & Vehicle Data Expert
Published 6 October 2026
Written by George Arnold
Related reading
Nearly-New & Ex-Demo Cars: What Service History to Expect
Buying an ex-demo or nearly-new car? What service history to expect, why the dealer is the first owner, and how to verify the mileage and first-service trail.
Should You Buy a Car With No Service History?
Buying a used car with no service history? What it really costs, how much to knock off the price, how to recover the records, and when to walk away.
What Is an HPI Check? (And What It Doesn't Tell You)
What an HPI check covers — finance, write-offs, theft, mileage — and the one big thing it doesn't show: how the car was actually looked after.
Key findings (free to cite with attribution to FindServiceHistory):
- Software is now behind about 1 in 8 UK car recalls. 12.6% of recalls launched in 2020–2025 describe a fault in software, calibration or programming, up from 2.9% in 2010–2014.
- A quarter are fixed with a software update. 24.7% of recalls in 2020–2025 are remedied by updating or reprogramming software, against 7.7% in 2010–2014 — often for a fault that is not itself in the software.
- Hybrid and electric systems went from 1 in 100 recalls to 1 in 10. High-voltage batteries, charging equipment and electric drive units feature in 10.0% of recent recalls, against 1.0% in 2010–2014.
- Recall campaigns have roughly tripled. An average of about 325 a year in 2020–2025, against about 104 a year in 2010–2014; the peak was 371 in 2019.
- About half of fire-risk recalls now involve a hybrid or electric car's battery or charging system — 55 of 99 in 2020–2025, against 1 of 55 in 2010–2014. Fire-risk recalls on conventional systems fell over the same period.
- The old mechanical themes have fallen back as a share. Brakes went from 18.8% of recalls to 10.5%, and fire risk overall from 10.6% to 5.1%.
Why we looked at this
Recall work is part of a car's service history. When a franchised dealer carries out a recall it is normally logged against the car, and in our own service history research about one manufacturer record entry in fifty is a recall-only visit. DVSA publishes every recall it is notified of, including the manufacturer's own description of the fault and the fix, which lets anyone see how the reasons for recalls have changed.
Method
We used DVSA's vehicle recall file, published under the Open Government Licence, filtered to car and van recalls for vehicles built from 2000 onwards (truck, bus, motorcycle and machinery divisions removed). That gives 4,766 recall campaigns, each counted once however many models it names. We compare 2010–2014 (520 recalls) with 2020–2025 (1,951); 2026 is incomplete and is left out of the comparisons.
Themes are matched on the words DVSA records for each recall's concern, defect and remedy. "Fault is in software" means the concern or defect mentions software, calibration, programming or firmware. "Fixed by a software update" means the remedy does. We checked each theme by reading a sample of matching recalls and tightened the wording where it caught the wrong thing — for example, "brake" no longer counts a high-level brake light.
Recall campaigns have roughly tripled
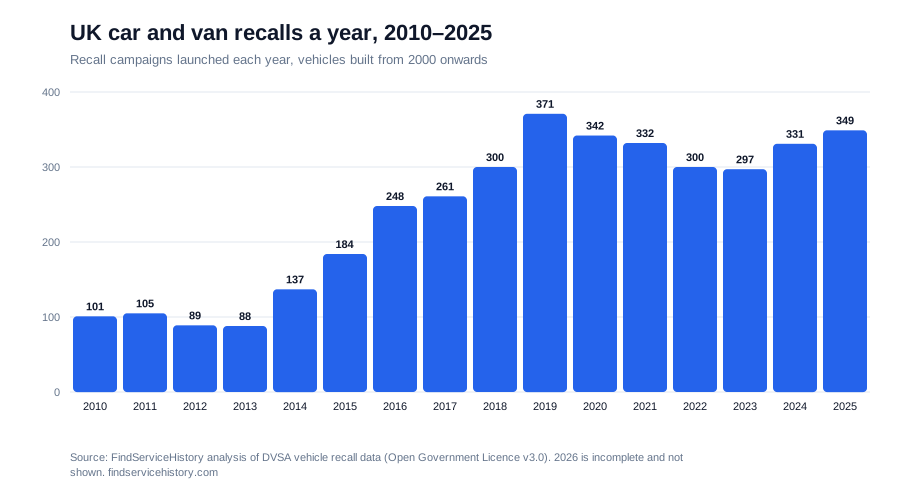
Recalls ran at around 90 to 105 a year from 2010 to 2013, climbed steeply from 2014 and peaked at 371 in 2019. Since 2020 they have settled at between roughly 300 and 350 a year. The averages are about 104 a year in 2010–2014, 273 in 2015–2019 and 325 in 2020–2025.
That is a count of campaigns, not of cars, and it should not be read as cars getting three times worse. There are more models and variants on sale, each carrying far more electronics, and a recall that once covered one model now often names several that share a part. Part of the rise in the early years is also the build-year filter: recalls on cars built before 2000 are left out, which trims the earliest years slightly.
What recalls are about now
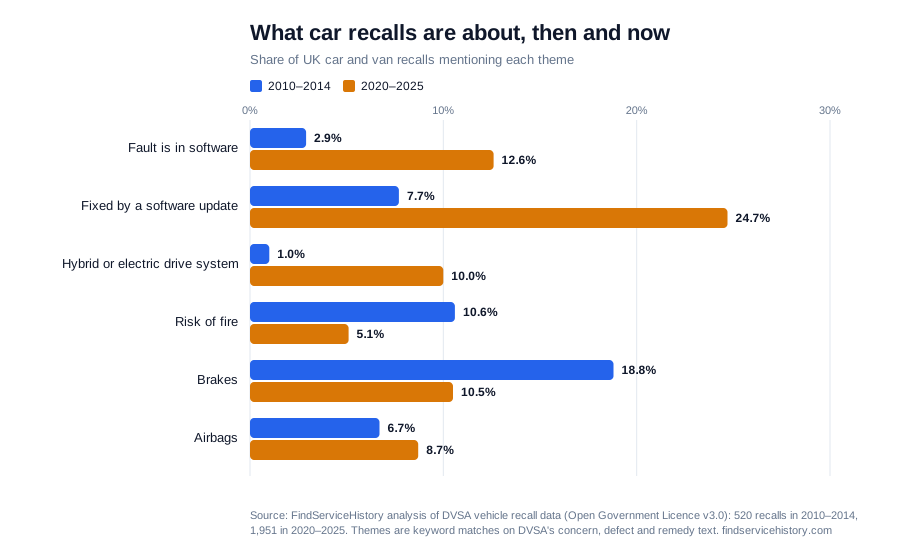
| Theme | 2010–2014 | 2015–2019 | 2020–2025 |
|---|---|---|---|
| Fault is in software | 2.9% | 6.1% | 12.6% |
| Fixed by a software update | 7.7% | 13.9% | 24.7% |
| Hybrid or electric drive system | 1.0% | 1.8% | 10.0% |
| Risk of fire | 10.6% | 6.7% | 5.1% |
| Brakes | 18.8% | 9.4% | 10.5% |
| Airbags | 6.7% | 15.5% | 8.7% |
| Seat belts | 3.3% | 6.2% | 4.6% |
Software is the biggest change. In 2010–2014 only 15 of 520 recalls described a fault in software; in 2020–2025 it was 245 of 1,951. They range from engine and battery management to lane-keeping, cameras and emergency-call systems. Recent examples in the DVSA file include a traction-battery monitoring unit with a software error, a steering system whose backup software did not meet specification, and a camera module that gave too little warning time.
Software is also how a quarter of recalls are fixed — 482 of 1,951 in 2020–2025. Sometimes the software is the fault; often it is the cure for a physical one, such as an updated detection routine that warns of a worn part, or reprogrammed battery management on a hybrid or electric car. For the owner, it usually means a short dealer visit rather than new parts.
Hybrid and electric systems went from almost nothing to 1 in 10. Five recalls in 2010–2014 involved a high-voltage battery, charging equipment or an electric drive; 196 did in 2020–2025. That tracks how many electrified models are now on sale. It does not show that any individual electric car is more likely to be recalled, because the file does not tell us how many of each type of car are on the road.
The mechanical themes have fallen back as a share, not disappeared. Brake recalls were almost one in five in 2010–2014 and are about one in ten now. Fire risk halved as a share, from 10.6% to 5.1%, and what causes them has changed completely. In 2010–2014 only one of 55 fire-risk recalls involved a hybrid or electric system; in 2020–2025 it was 55 of 99, almost all of them high-voltage battery cells or modules that can overheat, plus a few charging cables. Fire-risk recalls on everything else fell from 54 to 44. Two cautions: one battery fault can produce a separate recall for each brand that uses it (a single Stellantis battery issue accounts for several Peugeot, Citroën, DS and Vauxhall campaigns), and a recall is a precaution on a batch of cars, not a record of fires. Airbag recalls peaked at 15.5% in 2015–2019, the years of the worldwide Takata inflator recalls, and have since fallen to 8.7%.
Check a vehicle's service history
Retrieve official manufacturer dealership service records using just a registration number. Results typically arrive within minutes. Your card is authorised but not charged unless we find records.
Run a Service History Check — £9.99No charge unless we find records
What this means for owners and buyers
- Check for outstanding recalls — it is free. The government's vehicle recall checker works from the make, model and VIN, and our free MOT history check shows DVSA's outstanding-recall flag for the car where there is one.
- On a used car, look for the recall work in the history. Recall work done at a franchised dealer is normally recorded against the car, so a service history check can show whether it was carried out.
- Don't ignore a software recall. It is easy to treat "software update" as optional. Many fix safety systems — braking assistance, steering, battery management — and take less than an hour at a dealer.
Caveats and limitations
- Campaigns, not cars. A recall can cover a few vehicles or hundreds of thousands. These figures count campaigns.
- Keyword themes. Themes come from matching DVSA's own text. We checked samples of each, but a recall described in unusual wording can be missed, and one recall can sit in more than one theme.
- No brand league table. Without the number of each model on the road, counting recalls per brand would mostly measure how many models a brand sells, so we do not publish one.
- Vehicles built from 2000. Recalls on older cars are excluded, which slightly trims the earliest years in the trend.
Use this data
These findings are free to cite with attribution to FindServiceHistory and a link to this page. Suggested attribution:
Source: FindServiceHistory analysis of 4,766 DVSA vehicle recall campaigns (cars and vans built from 2000), October 2026. Contains public sector information licensed under the Open Government Licence v3.0.
For a custom cut — a particular theme, period or type of vehicle — email research@findservicehistory.com. More of our research is in the press room.
Check a vehicle's service history
Retrieve official manufacturer dealership service records using just a registration number. Results typically arrive within minutes. Your card is authorised but not charged unless we find records.
Run a Service History Check — £9.99No charge unless we find records