UK Service History Coverage Report 2026: Brand by Brand
Original research on 5,563 UK car checks: 7 in 10 have a manufacturer service record, the dealer trail stops near age five, 1 in 80 has a mileage discrepancy.
George Arnold · Founder & Vehicle Data Expert
Published 16 May 2026 · Updated 6 October 2026
Written by George Arnold
Related reading
Selling Your Car With Full Service History
Maximise your car's sale price with complete service documentation. Tips on servicing, organising records, and presenting history to buyers.
Used Car Service History Checklist for Buyers
Complete checklist for verifying a used car's service history before buying. Check intervals, stamps, mileage consistency, and more.
Red Flags in Used Car Service Records
Spot warning signs in service history before you buy. Learn to identify mileage discrepancies, fake stamps, irregular intervals, and other red flags.
Key findings (free to cite with attribution to FindServiceHistory):
- About 7 in 10 UK used cars have a traceable manufacturer service record — 69.9%. The other 30.1% returned no manufacturer service records at all. Based on 5,563 real vehicle lookups run between March and October 2026.
- The main-dealer trail usually stops at around five years old. Among cars aged eight or more, the last itemised main-dealer service came at a median age of 4.9 years (5.6 counting a dealer visit of any kind). Only 23.6% of seven- and eight-year-old cars had a main-dealer service in the two years before they were checked.
- Around 1 in 80 cars shows a mileage discrepancy. 1.3% of vehicles with two or more MOT readings had an odometer reading that went backwards, and where it did, a median of 14,311 miles had gone from the record. Four runs on successively larger samples have returned 1.4%, 1.4%, 1.2% and 1.3%.
- About 1 in 18 manufacturer records holds nothing but the handover. 5.7% of cars with a record show only the pre-delivery inspection from the day they were sold new — and the median one is nearly seven years old.
- Digital-record availability varies enormously by brand — from 96% of BMWs to nothing at all on the Hyundai, MG and Suzuki samples. This measures how accessible each manufacturer's records are, not how well the cars were looked after.
- Only about half the entries in a digital service record are actually services. 54.2% itemise scheduled maintenance; the rest are recalls, warranty work, fault investigations, pre-delivery inspections or entries with no work listed. A long list of stamps is not the same as a well-serviced car.
- About 1 in 27 has been serviced abroad. 3.8% of cars with a record carry at least one dealer entry from outside the UK — most often Germany.
- Records are fullest on seven- to nine-year-old cars (79.2% have one) and on diesels (73.3%, against 67.8% for petrol).
Corrections in this edition (October 2026)
- Ford. The previous edition put Ford at 9.6% and said Ford doesn't make its records available to the lookups the trade uses. That was wrong. Ford's manufacturer feed stopped returning records from 1 May 2026, and our data provider confirmed in September that the fault is at Ford's end. Before the outage, 33.7% of Fords returned records. Lookups made during the outage are now excluded.
- Vauxhall. We found a second, shorter outage that nobody had reported: no Vauxhall records at all between 6 May and 19 June 2026. Those lookups are excluded too.
- Dates. Earlier editions described the sample as "August 2024 to August 2026". That was the bound of a rolling two-year filter, not when the lookups were run. Every lookup in the sample dates from March 2026 onwards.
- What it changes. The no-record figure falls from 36.5% to 30.1%. Measured the old way, today's larger sample would still read 36.0%, so almost all of that fall is the correction rather than new data. If you cited 36.5%, please update it to 30.1% with the new sample size.
Why we ran this research
When you buy a used car in the UK, "full service history" is one of the most over-used phrases in the classified ads. But how often is it actually true? DVLA publishes registration data and the DVSA publishes MOT data, but nobody publishes how often manufacturers' own digital service systems actually return records when you query them — how long cars stay in the franchised network, or how often the mileage on their records doesn't add up.
We can. FindServiceHistory runs dealership service-record and MOT lookups every day for UK car buyers, sellers and motor traders. We aggregated those lookups (with all personal data stripped out) to answer three questions: which UK car brands actually have retrievable digital service records, when do cars stop going to the main dealer, and how often does a car's recorded mileage go backwards?
Methodology
This report is based on 5,563 anonymised UK vehicle lookups run between March and October 2026, encompassing 21,415 individual dated workshop entries and 37,641 MOT test records. The lookups are recent, but the records they return are not: a seven-year-old car's record reaches back seven years. Coverage is defined as the percentage of lookups where the manufacturer's digital service record system returned at least one logged entry. Note that wording: an entry is a workshop visit, and only about half of them are a scheduled service — which is why the service-interval figures further down use a deliberately narrower definition than the coverage figures.
A brand's hit rate is not a measure of its feed. Our data source classifies each manufacturer into one of three contracted tiers: full ("we expect to receive data on any recorded services"), limited ("data in a minimal proportion of cases") and workshop remarks (recalls and warranty work only — services are not included). Those are three different things, not one scale, so a low hit rate on a full-coverage brand says nothing about the feed: it is a property of the population being looked up. Our own book is UK retail and van trade, where a great deal of servicing happens outside the franchised network and therefore never reaches the manufacturer's system at all.
Sensitivity check. Three brands returned zero records across their entire sample and are not contracted to return services in the first place — Hyundai (workshop remarks, n=127), MG (n=85) and Suzuki (limited, n=59). For those, a blank result carries no information about the car. Excluding all 271 of them, the headline moves from 30.1% to 26.5% with no service history. We publish the all-brands figure as the headline because it is what a buyer actually experiences when they run a check, and the feed-adjusted figure here so the difference is visible rather than argued about. We do not exclude brands merely for having a low hit rate — that would condition the result on the outcome.
Brand-level coverage results are reported only where we have at least 30 lookups for that manufacturer (28 brands meet this threshold). MOT rankings require at least 50 MOT tests on file. Service intervals count only entries whose itemised work confirms scheduled maintenance, and require at least 30 measurable gaps between consecutive such visits on the same vehicle (13 brands). Mileage-anomaly rates are shown per brand only where we have 50 or more vehicles with two or more MOT readings. No vehicle, owner, or registration is identifiable in any figure below.
Outages are taken out, not counted as empty cars. A manufacturer feed can stop while our data provider keeps answering every other make, and when it does, each lookup on that make comes back looking exactly like a car with no records. Since this edition we screen every make for runs of empty results too long to be chance given that make's own hit rate. Two turned up, and lookups made inside them are excluded from the sample entirely:
- Ford, from 1 May 2026 — 484 lookups, of which 6 returned anything. Our provider confirmed on 23 September that the fault is at Ford's end, and it was still unresolved when this edition was prepared. Ford lookups from before 1 May stay in.
- Vauxhall, 6 May to 19 June 2026 — 35 lookups from 25 different customers, every one empty, against a Vauxhall hit rate of about 86% either side. Several of the same customers received Vauxhall records just before and just after. This one has not been confirmed by the provider; we exclude it on the strength of the data and say so here.
The screen also raised a run of 12 empty Mercedes-Benz lookups in April 2026. Seven of those came from one dealer checking a batch of older cars, who received records again the next day, so we judged it a real run of cars without records rather than an outage and kept it in.
One earlier correction still applies. For three days in July 2026 our data provider stopped answering queries, and 85 lookups were recorded as "no records" when in fact nothing had been asked successfully. We re-ran all 85: 46 did have service history and are counted here as such (using their re-verified records), 20 were confirmed genuinely empty, and the 19 that could not be re-verified are excluded from the sample entirely rather than guessed at.
What "no service history" means — and doesn't. A blank result does not mean the car was never serviced. It means there is no digital record retrievable from the manufacturer's own service database. That happens for two very different reasons: the car genuinely wasn't serviced (or was serviced only at independent garages that never fed records back), or the manufacturer's records simply aren't available to the lookup systems the trade uses. Some brands — notably Hyundai, MG, Suzuki and Honda — fall heavily into the second category. So a low coverage figure for those brands is largely a measure of data availability, not owner neglect. We flag this throughout, because it changes how you should read the brand table.
Headline finding: about 3 in 10 used cars have no digital service trail
Across all 5,563 vehicles in the sample, 1,674 (30.1%) returned zero service records from the manufacturer's digital system. A buyer relying on a digital check would, in roughly three cases in ten, find nothing.
Age matters more than you might expect. Records are thinnest on the newest and the oldest cars, and fullest in the middle:
| Age at the check | Records returned | Sample |
|---|---|---|
| Up to 3 years | 62.3% | 469 |
| 4–6 years | 70.8% | 1,280 |
| 7–9 years | 79.2% | 1,892 |
| 10–14 years | 65.9% | 1,614 |
| 15 years and over | 36.4% | 239 |
The newest cars have often not reached their first service yet. The oldest have spent years outside the franchised network, or predate the manufacturer's digital system altogether. By fuel, diesels return a record most often (73.3%), ahead of hybrids (69.4%), petrol (67.8%) and pure-electric cars (65.1%).
Digital-record availability varies hugely by brand
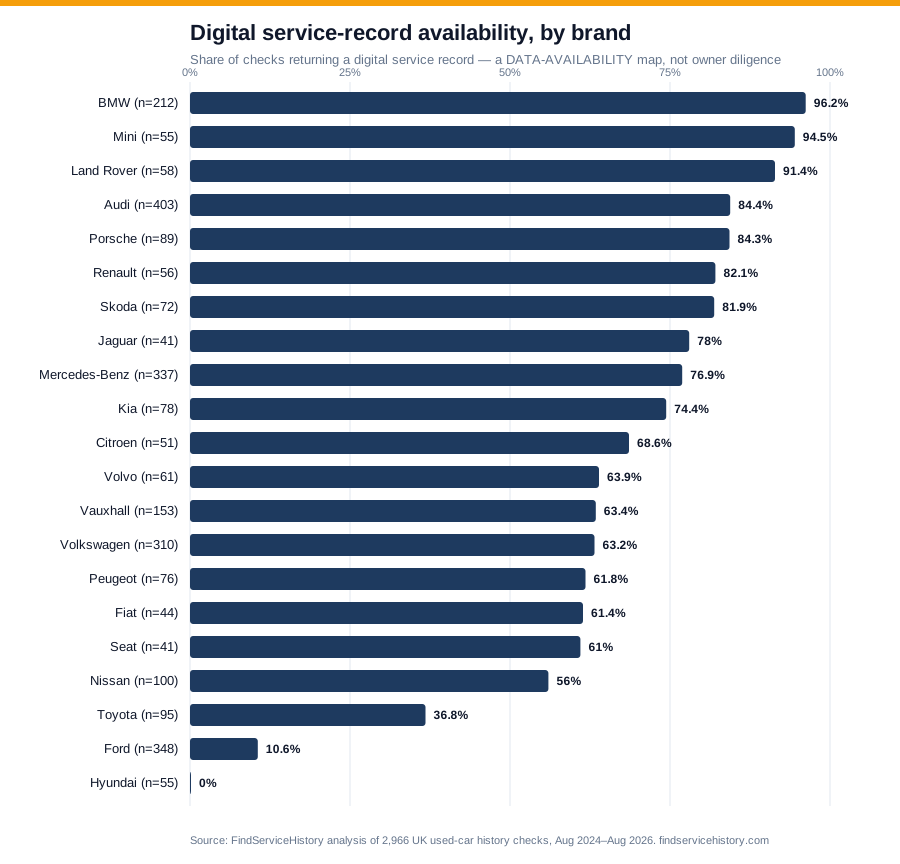
Of the 28 brands with enough sample size to publish, the share of lookups that returned at least one digital service record:
| Brand | Records returned | Sample |
|---|---|---|
| BMW | 96.0% | 403 |
| MINI | 94.9% | 136 |
| Dacia | 94.4% | 36 |
| Land Rover | 91.2% | 114 |
| Vauxhall | 85.9% | 298 |
| Porsche | 85.0% | 167 |
| Cupra | 83.9% | 31 |
| Audi | 83.7% | 925 |
| Jaguar | 82.5% | 63 |
| Lexus | 82.4% | 34 |
| Škoda | 82.1% | 145 |
| Renault | 80.0% | 115 |
| Mercedes-Benz | 78.9% | 668 |
| Kia | 73.5% | 151 |
| Citroën | 70.1% | 117 |
| Peugeot | 67.2% | 186 |
| Fiat | 65.9% | 82 |
| Volkswagen | 65.7% | 610 |
| Mazda | 65.2% | 66 |
| Volvo | 64.5% | 107 |
| SEAT | 62.3% | 106 |
| Nissan | 54.8% | 199 |
| Ford | 33.7%* | 101 |
| Toyota | 31.4% | 153 |
| Honda | 8.3% | 36 |
| Hyundai | 0%† | 127 |
| MG | 0% | 85 |
| Suzuki | 0% | 59 |
| * Ford: lookups from March and April 2026 only. Ford's feed has returned no records since 1 May 2026, and lookups made since then are excluded (see the methodology). 101 lookups is a small base, so treat 33.7% as a rough guide. † Hyundai's 0% means its service records are not accessible via the trade lookup systems we query — not that Hyundai owners don't service their cars. Read every low figure in this table as a measure of data availability, not owner neglect. | ||
The premium German brands, MINI and Land Rover sit at the top — a digital check on a used BMW, Audi or Mercedes returns records in the large majority of cases. At the other end, Toyota (31.4%) and Honda (8.3%) return records rarely, and Hyundai, MG and Suzuki returned none at all.
Read this as an availability map, not a neglect map. The gap is driven mainly by how openly each manufacturer's digital service data can be retrieved. BMW, Audi and Mercedes built centralised, queryable dealer records early; Hyundai, MG and Suzuki records are not available through the systems we query at all. So Hyundai's 0% reflects that — not that no Hyundai in Britain gets serviced.
The practical implication for buyers: the absence of a digital service history is much weaker evidence of neglect on a used Hyundai, Toyota or Honda than on a used BMW. For the low-availability brands, ask the seller for paper records or independent-garage invoices. For a BMW or Audi, a missing digital trail is a genuine red flag worth walking away from. And on a Ford, while the manufacturer's feed is down, a blank result currently tells you nothing at all.
Check a vehicle's service history
Retrieve official manufacturer dealership service records using just a registration number. Results typically arrive within minutes. Your card is authorised but not charged unless we find records.
Run a Service History Check — £9.99No charge unless we find records
When cars leave the main dealer: at around five years old
A manufacturer's record tells you more than whether a car was serviced. It shows when the franchised dealer stopped seeing it. For the cars in our sample aged eight or more — old enough that the record had room to carry on well past a three-year warranty — we looked at when the last main-dealer service took place.
The median car had its last itemised main-dealer service at 4.9 years old (1,490 cars), and just over half (51.5%) had it before their fifth birthday. Counting a dealer visit of any kind, rather than only visits that itemise a service, moves the median to 5.6 years (1,794 cars). The single most common point for the trail to stop is at two or three years old: 29.2% of these cars had their last dealer service then — the age at which a standard three-year manufacturer warranty ends. That is a coincidence in timing; our data cannot show why owners move on.
Looked at the other way — what share of cars of each age had a main-dealer service in the two years before they were checked — the decline is steady. This is limited to brands contracted to return full service data, so that a blank is about the car rather than the feed:
| Age at the check | Main-dealer service in the previous two years | Sample |
|---|---|---|
| 2–4 years | 42.4% | 590 |
| 5–6 years | 30.5% | 735 |
| 7–8 years | 23.6% | 987 |
| 9–10 years | 14.6% | 865 |
| 11–14 years | 10.3% | 747 |
Brands differ a great deal. Counting a dealer visit of any kind, the median car aged eight or more was last seen by a franchised dealer at 8.6 years for BMW, 8.0 for Porsche and 7.3 for MINI, against 5.9 for Audi, 5.8 for Kia, 5.0 for Mercedes-Benz, 4.2 for Vauxhall and Volkswagen, 3.3 for Škoda, 3.0 for Peugeot and 2.5 for Nissan.
Three cautions before anyone reads this as "cars stop being serviced at five". First, independent garages are invisible to a manufacturer record, so this measures when the franchised trail stops, not when servicing stops. Second, these are cars being checked before a sale, not a random sample of cars on the road. Third, some brands log far more of what their dealers do than others (see below), which is why we give both the itemised-service and the any-visit figures. For a buyer, the practical point is simple: on a car much older than five, expect the main-dealer record to end somewhere, and ask what happened after it.
Handover only: records with nothing after the day the car was sold
A franchised dealer opens a record against the car when it is handed over new, with a pre-delivery inspection. On a car that was then serviced in that network it is the first of many entries. On a car that never went back, it is the only one. 220 of the 3,853 cars with a record (5.7%, about 1 in 18) showed nothing but that handover, and the median one was 6.9 years old at the time of the check. A record like that confirms the car existed and where it was first sold — and nothing about how it has been maintained since. More broadly, 15.7% of records contain a single entry of any kind.
Serviced abroad: about 1 in 27
145 of the 3,853 cars with a record (3.8%) carry at least one dealer entry from outside the UK. Germany accounts for most of them (91), followed by France (14), Japan (9), Italy (8) and Ireland (5). Most will be imports or cars that spent part of their life abroad. We detect these from the servicing dealer's address, and not every address names a country, so 3.8% is a floor. Records from abroad are often in the servicing dealer's own language; our reports translate them.
Mileage discrepancies: how often the odometer goes backwards
Because the DVSA records a car's mileage at every MOT, a rolled- back odometer usually leaves a fingerprint: a later test showing fewer miles than an earlier one. We checked all 4,796 vehicles in the sample with two or more MOT readings for exactly this.
60 of them (1.3%, about 1 in 80) had a reading that dropped by more than 1,000 miles between tests. Where a discrepancy appeared, it was rarely small: the median drop was 14,311 miles and the mean 39,239 — the equivalent of hiding well over a year's driving. This is a deliberately conservative floor: a rollback done between MOTs, or below the 1,000-mile threshold, wouldn't be caught, so the true rate is higher.
That figure is worth dwelling on, because we have now measured it four times on successively larger samples and got 1.4%, 1.4%, 1.2% and 1.3%. More than doubling the sample across those runs has barely moved it — the strongest evidence we have that somewhere around 1 in 70 to 1 in 80 is the real order of magnitude for scrutinised used cars, not an artefact of a small sample.
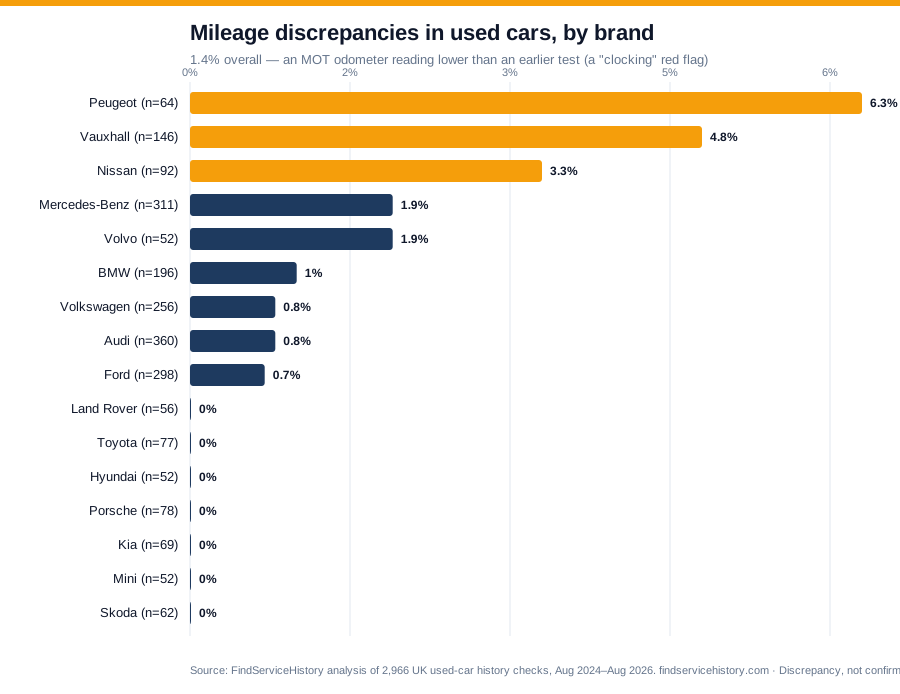
Among brands with 50+ eligible cars, the anomaly rate was highest for:
| Brand | Discrepancy rate | Cars checked |
|---|---|---|
| Nissan | 4.5% | 176 |
| Suzuki | 3.9% | 51 |
| Peugeot | 3.4% | 145 |
| Vauxhall | 2.6% | 272 |
| Citroën | 2.4% | 85 |
| Mercedes-Benz | 1.8% | 599 |
| Mazda | 1.7% | 60 |
| Jaguar | 1.7% | 59 |
| Porsche | 1.3% | 149 |
| Fiat | 1.3% | 77 |
| Volvo | 1.1% | 93 |
| Renault | 1.1% | 90 |
| Volkswagen | 1.0% | 512 |
| Land Rover | 0.9% | 109 |
| Toyota | 0.8% | 123 |
| Kia | 0.8% | 122 |
| BMW | 0.5% | 366 |
| Audi | 0.5% | 818 |
| Ford | 0% | 79 |
| Hyundai | 0% | 102 |
| MG | 0% | 59 |
| MINI | 0% | 127 |
| Škoda | 0% | 129 |
| SEAT | 0% | 95 |
Small brands move a lot on a single car: Suzuki's 3.9% is two vehicles out of 51. A caveat worth stating plainly: not every backwards reading is fraud. A replaced instrument cluster, or a keying error at the test centre, can produce the same pattern — which is why we report a discrepancy, not confirmed clocking. But every one is worth questioning before you buy. You can check any car's MOT mileage trail for free with our car mileage & MOT history checker, and our guide explains how to check if a car has been clocked.
A digital service record is a log of workshop visits — not a log of services
This changes how anyone should read a digital service record. A manufacturer's system does not record "services". It records every occasion the car was booked into a franchised workshop, and only about half of those visits turn out to be a scheduled service. Classifying every dated entry in the sample by the work actually itemised against it:
| What the entry actually records | Share of all entries |
|---|---|
| Scheduled maintenance (oil, filters, plugs, brake fluid, inspection) | 54.2% |
| No itemised work returned — unverifiable | 23.5% |
| Other workshop visit (fault diagnosis, warning light, road test) | 18.5% |
| Recall or manufacturer campaign only | 2.1% |
| Warranty repair only | 1.0% |
| Pre-delivery inspection | 0.6% |
So a car showing twelve entries has not necessarily been serviced twelve times. Some of those entries are a recall on a brake hose, a warranty claim on a control unit, an investigation into a dashboard warning light, or the pre-delivery inspection from the day the car was first handed over. Count the services, not the stamps — and read the itemised work, which is exactly why our reports print it rather than just a date and a mileage.
How much a dealer network logs varies enormously by brand, so this is not a uniform effect. Of BMW's 5,435 entries only 1,379 itemise scheduled maintenance (25%); for MINI it is 286 of 1,389 (21%). At the other extreme, 3,259 of Audi's 3,530 entries do (92%), and Volkswagen is 93%. Kia's 251 entries in our sample itemise no maintenance at all. These are different record-keeping conventions, not differences in how the cars were treated — but it means the raw number of entries in a record is not comparable between badges.
How often are these cars actually serviced?
Restricted to visits with confirmed scheduled-maintenance work, and collapsing multiple entries sharing one date into a single visit, this is the typical (median) gap between services. The right-hand column gives the manufacturer's schedule — but read the caution below it first, because for most of these brands there is no single figure:
| Brand | Median gap | Median miles | Cars | Manufacturer's schedule |
|---|---|---|---|---|
| Porsche | 9.6 mo | 5,043 | 135 | Current models incl. Taycan & Macan Electric 2 yr / 20,000 mi (a cap on Macan, Cayenne & Panamera — the car can call sooner); older 3.8 911s 12 mo / 10,000 mi |
| Vauxhall | 10.2 mo | 5,931 | 185 | No single figure — GM-era petrol often 12 mo / 20,000 mi; Stellantis-era on PSA schedules |
| Alfa Romeo | 10.2 mo | 5,541 | 13 | Varies by model and engine — check the car's own schedule |
| Škoda | 11.8 mo | 9,502 | 100 | Fixed 12 mo / ~9,300 mi, or Longlife up to 2 yr / 19,000 mi |
| Mazda | 11.9 mo | 8,205 | 36 | Skyactiv petrol and diesel alike 12 mo / 12,500 mi |
| BMW | 12.0 mo | 12,645 | 293 | Condition-based — no fixed mileage published |
| Volkswagen | 12.0 mo | 9,814 | 325 | Fixed 12 mo / ~9,300 mi, or Longlife up to 2 yr / 19,000 mi |
| MINI | 12.0 mo | 11,756 | 75 | Condition-based — no fixed mileage published |
| Mercedes-Benz | 12.1 mo | 9,189 | 400 | ASSYST: condition-based, ~9,000–18,500 mi and 12–24 mo |
| SEAT | 12.2 mo | 9,596 | 45 | Fixed 12 mo / ~9,300 mi, or Longlife up to 2 yr / 19,000 mi |
| Audi | 12.4 mo | 9,337 | 660 | Fixed 12 mo / ~9,300 mi, or Longlife up to 2 yr / 19,000 mi |
| Land Rover | 12.8 mo | 10,655 | 90 | Ingenium diesel up to 2 yr / 21,000 mi; Ingenium petrol 12 mo / 16,000 mi to ~2019, then 2 yr / 21,000 mi; older V6/V8 12 mo / 16,000 mi |
| Jaguar | 13.0 mo | 10,715 | 41 | Ingenium diesel up to 2 yr / 21,000 mi; Ingenium petrol 12 mo / 16,000 mi to ~2019, then 2 yr / 21,000 mi; older V6/V8 12 mo / 15,000–16,000 mi |
The striking result is how little variation there is. All thirteen brands fall between 9.6 and 13.0 months, so the dramatic brand spread implied by counting every workshop entry simply isn't there. (Alfa Romeo clears the bar on gaps but rests on only 13 cars, so treat its row as indicative.)
Read that as a comparison between badges, not as a rate for the fleet. It is tempting to round it off to "cars get serviced about once a year", and that would be wrong. The figure measures the gap between consecutive services recorded at a franchised dealer, on cars that had at least two of them, and it discards any gap longer than four years as a data error. Work done at an independent garage is invisible to it. The 30.1% of cars with no digital record at all are outside it entirely, and a car serviced once and then abandoned contributes nothing, because a single service creates no gap to measure. Those filters remove most of the ways a car can go unserviced, so a result near twelve months is close to what the method is bound to produce. It is a fair way to compare one badge against another — every brand is filtered identically — and a poor way to estimate how often the cars on the road are actually maintained.
A warning about that right-hand column: a brand does not have "a" service interval. It varies by engine, by model year, and by which schedule the car was sold on — often by a factor of two within a single badge. Jaguar and Land Rover's early Ingenium petrols run to 16,000 miles a year, while the Ingenium diesels — and the petrols from around 2020 — run up to two years and 21,000 miles. Mazda is the exception: its Skyactiv petrols and diesels share one 12-month, 12,500-mile schedule. Kia asks 10,000 miles of a turbocharged petrol and 20,000 of a naturally-aspirated one. Hyundai services its petrols every 10,000 miles and its diesels every 20,000, both annually. BMW, MINI and Mercedes-Benz publish no fixed mileage at all — their cars compute the interval from how they are actually driven. Renault's own published guidance is simply that the schedule "varies by model and engine type". The column above is therefore a rough guide to the regime, not a specification for any individual car.
This is also why we do not rank brands by "service discipline": the schedules being measured against are not the same, and often not even the same within a brand. Jaguar and Land Rover sit at the long end of the table and look like the laggards until you notice that the Ingenium diesels among them are on a two-year schedule and are therefore being serviced roughly twice as often as required. Ranking those cars against a Porsche on a different schedule again tells you nothing about either owner. Judge a car against its own schedule, not against another brand's — and not against its own badge's average.
Mileage is where the real differences sit, and they are mostly about how the cars are used. Porsche owners cover only about 5,000 miles between services and Vauxhall owners around 5,900 — far inside any of the distance limits that apply to them. On the Vauxhalls the time-based half of the schedule triggers first on low-mileage and short-trip cars; the Porsches are being serviced inside even their time limit, which on current models is two years. BMW owners cover 12,645 miles, which sits comfortably within the range a condition-based system produces in normal use — the car asked for the service when it was due, which is the system working as designed. The VW Group brands are the most interesting: Audi at 9,337 miles, Škoda at 9,502, SEAT at 9,596 and Volkswagen at 9,814 all cluster near the ~9,300-mile fixed interval and nowhere near the 19,000-mile Longlife one, which suggests most VW Group cars in the sample are on fixed servicing rather than the flexible schedule the brochures emphasise.
What is excluded, and why. Nearly a quarter of all entries came back with no itemised work at all. We drop those rather than assume they were services: counting them would reintroduce the exact bias this measure removes, most of all on BMW and MINI. Dropping them stretches the measured gaps, so on that count the figures are conservative. Pulling the other way, we discard any gap shorter than a month or longer than four years as a data error, and cutting the long tail shortens the median — a car that sat for five years between dealer visits is not represented here at all. The two effects work in opposite directions and we have not tried to net them off, so treat these as a like-for-like comparison between brands rather than a precise figure for any of them. A brand needs at least 30 measurable service-to-service gaps to appear, which is why thirteen brands qualify here against twenty-eight in the coverage table. Toyota, Kia, Lexus, Citroën, Dacia and Peugeot are absent because their records in this sample contain almost no itemised service work to measure; Ford is absent because its feed was down for most of the period.
MOT advisories: which brands hold up between tests
Cross-referencing with MOT data shows which brands stay clean between tests. We measured average advisory items per MOT test across every car brand with 50 or more tests on file. The extremes — cleanest first, then the highest-advisory brands:
| Brand | Avg advisories / test | MOT fail rate |
|---|---|---|
| Bentley | 0.34 | 6.7% |
| Aston Martin | 0.54 | 12.7% |
| DS | 0.72 | 25.0% |
| Dacia | 0.73 | 20.4% |
| Porsche | 0.73 | 13.4% |
| MINI | 0.85 | 15.6% |
| — highest advisories — | ||
| SEAT | 1.34 | 17.0% |
| Alfa Romeo | 1.37 | 18.9% |
| MG | 1.39 | 19.5% |
| Nissan | 1.40 | 19.2% |
| Abarth | 1.41 | 21.1% |
| Mitsubishi | 1.42 | 18.1% |
Bentley, Aston Martin and DS collect the fewest advisories per test; Mitsubishi, Abarth, Nissan and MG collect roughly twice as many as Porsche or MINI. Advisory count and fail rate don't always move together — DS is among the cleanest on advisories (0.72) yet has the highest fail rate in the set (25.0%, though on only 68 tests), and Dacia pairs 0.73 advisories with a 20.4% fail rate, while Lexus posts the lowest fail rate of any mainstream brand (12.7%). To see where a particular car sits, our free MOT checker lists every advisory and failure on its record, test by test. Our separate MOT failure study looks at whether a recent dealer service makes a car less likely to fail. The full brand table, including first-fail mileages, is available to journalists and researchers on request (see below).
What this means for car buyers
Five practical takeaways if you're shopping for a used car:
- Treat "FSH" in the listing as a claim, not a fact. About three cars in ten have no digital service history at all — even when sellers describe them as having one. A service history check verifies the claim before you put down a deposit.
- Check the mileage trail first — it's free. Around 1 in 80 cars shows an odometer reading that went backwards, and where it does the amount hidden is substantial. Our free mileage checker flags it in seconds.
- Calibrate your expectations by brand. A missing digital trail on a seven-year-old BMW is a serious red flag (because 19 in 20 do have records). The same gap on a Hyundai, Toyota or Honda is common and far less telling — ask for paper or independent-garage invoices instead. On a Ford, it tells you nothing until Ford's feed is restored.
- On an older car, find out where the dealer trail ends. Most cars leave the main dealer at around five. A record that stops is normal; a record that stops with no paperwork from anywhere after it is the question to ask the seller.
- Count the services, not the entries. Only about half the entries in a digital record are scheduled maintenance — the rest are recalls, warranty jobs and fault investigations, and on about 1 in 18 cars the only entry is the handover. Read the itemised work and check the gaps against that car's own schedule — which depends on its engine, not just its badge. Our free service schedule checker gives you the manufacturer's interval to measure against.
For a step-by-step guide, see our how to check service history before buying article.
What this means for motor traders
For dealers buying stock at auction or on part-exchange:
- Premium-brand stock without a digital service history should be discounted harder. A BMW or Audi without records is statistically more likely to have a genuine maintenance gap than a Hyundai or Toyota without records, where the blank usually just reflects data availability. Price the risk by brand.
- Always check the mileage trail on appraisal. A backwards MOT reading is the cheapest fraud signal to catch and the most expensive to miss on a part-exchange.
- Budget prep time for high-advisory brands. Mitsubishi, Abarth, Nissan, MG and Alfa Romeo all average close to 1.4 advisories per MOT — factor that into retail prep.
Dealers running 50+ checks a month can run lookups in bulk through our trade dashboard — or pay-as-you-go at £4.99 per check. See our dealer guide for how this fits into a buying workflow.
Caveats and limitations
Honest caveats, because nobody benefits from inflated claims:
- Coverage measures data availability, not maintenance quality. A car dutifully serviced at an independent specialist for 10 years returns zero records on a manufacturer digital check. The 30.1% no-history figure — and every brand figure — includes these cars.
- Selection bias: our sample is people who chose to run a check — pre-purchase buyers, traders evaluating part-exchanges, and owners recovering lost records. It is not a random sample of the UK car parc; it's a sample of vehicles being scrutinised, which is the population that matters most for buying decisions.
- Manufacturer feeds fail. Two did during this period. We now screen for that and exclude affected lookups, but an outage too short or too partial to stand out from normal variation would not be caught.
- The mileage-anomaly rate is a floor. It only counts drops greater than 1,000 miles that appear in the MOT record. Rollbacks between tests, smaller edits, or cars too new for MOT history are not captured, and some flagged cases are legitimate cluster replacements.
- Sample size: 5,563 vehicles is a solid sample for headline figures and the published brand cuts, but smaller brands fall below our thresholds and are excluded from the rankings, and brands near the threshold (Ford, Cupra, Lexus, Dacia, Honda) carry wide margins of error.
- Time window: the lookups were run between March and October 2026. Manufacturer systems and dealer practices evolve; year-on-year comparisons will need a longer dataset.
- Figures are revised as the sample grows. The no-record headline was 41% at 2,134 lookups in July 2026, 37.5% at 2,966 in early August, 36.5% at 3,626 in the previous edition, and is 30.1% at 5,563 today. Most of the last change is the Ford and Vauxhall correction described above, not new data. We update in place rather than republishing, so always cite the figure and the sample size together.
Use this data
All findings in this report are free to cite, quote, or republish with attribution to FindServiceHistory and a link back to this page (findservicehistory.com/blog/uk-service-history-coverage-research-2026). Suggested attribution line:
Source: FindServiceHistory UK Service History Coverage Report 2026, based on 5,563 anonymised vehicle lookups (March–October 2026).
Journalists or researchers wanting the full MOT table, additional cuts, or a custom angle can email research@findservicehistory.com. We can usually turn around a custom data pull within 48 hours.
We have also published research on what carmakers actually publish about service intervals and on how UK car recalls have changed since 2010. Everything is collected in our press room.
Check a vehicle's service history
Retrieve official manufacturer dealership service records using just a registration number. Results typically arrive within minutes. Your card is authorised but not charged unless we find records.
Run a Service History Check — £9.99No charge unless we find records