Do Serviced Cars Fail Fewer MOTs? We Analysed 3,815 Tests
Original research on 3,815 MOT tests: a documented dealer service in the previous 12 months cut the failure rate from 15.6% to 11.0% on cars aged 4-9.

George Arnold · Founder & Vehicle Data Expert
Published 26 August 2026 · Updated 6 October 2026
Written by George Arnold
Start here
How to check a car's service history online
Every route, free and paid, and how to read the record.
Related reading
Should You Buy a Car With No Service History?
Buying a used car with no service history? What it really costs, how much to knock off the price, how to recover the records, and when to walk away.
Cat S vs Cat N Write-Offs Explained
What Cat S and Cat N write-offs mean, whether they're safe to buy, how they affect value, and how to check repairs went through official dealers.
How to Check for Outstanding Finance on a Car
Why outstanding finance can get a car repossessed after you buy it, how to check for it before you pay, and what to do if finance is found.
Key findings — free to cite with attribution to FindServiceHistory:
- A documented main-dealer service in the previous 12 months is associated with an MOT failure rate of 11.4%, against 14.9% where none was recorded. Based on 3,815 MOT tests across 986 UK vehicles for which we hold both the manufacturer's service record and the full DVSA test history (p = 0.002).
- The effect is concentrated in cars aged four to nine: 11.0% versus 15.6% — a reduction of just under a third in relative terms (p = 0.0006).
- On cars aged nought to three there is no measurable effect at all — 11.5% versus 11.8%, which is statistical noise (p = 0.89). A nearly-new car passes its MOT whether or not a dealer touched it last year.
- Recently serviced cars also collect fewer advisories — 0.77 per test against 0.92 — and fewer individual defects per test (0.14 against 0.21).
- Tyres and suspension are what fail MOTs. Axles, wheels, tyres and suspension account for 41.7% of all failure items across 25,896 tests — more than brakes (18.0%) and lighting (15.2%) combined.
- About one in ten tyre and suspension advisories becomes a failure at the very next test (10.1%). For brakes it is 5.9%.
- 1.2% of UK cars — one in 86 — have an odometer reading that goes backwards in their MOT record, and the risk climbs steeply with age: 0.2% on cars up to five years old, 1.9% at 11-15 years, 2.7% beyond that.
Update, October 2026: the result held on a larger sample
We re-ran the headline comparison, unchanged in method, on 5,915 MOT tests across 1,525 cars, counting each car once. A test taken within 12 months of a recorded main-dealer service failed 11.0% of the time, against 14.5% when none was recorded (p < 0.0001). On cars aged four to nine it was 11.2% against 15.5% (p = 0.0002). On cars under four there was still no significant difference (10.4% against 11.4%, p = 0.51).
Everything below is the original August 2026 analysis of 3,815 tests on 986 cars, including the defect and advisory breakdowns, which we have not re-run. Earlier versions of this page gave the sample period as August 2024 to August 2026; that was the bound of a rolling filter, and the lookups themselves ran from March 2026.
The question nobody had the data to answer
"Full service history" is the most repeated phrase in the British classifieds, and the assumption underneath it is that a serviced car is a healthier car. It is an entirely reasonable assumption. It has also never really been tested, because testing it requires two datasets that almost nobody holds together.
The DVSA publishes MOT results. Manufacturers hold digital service records. The two live in different places, are governed by different rules, and are keyed differently — MOT data by registration, manufacturer data by VIN. To ask whether servicing predicts MOT outcomes you need both records for the same individual car, and enough cars to say anything meaningful.
That is a by-product of running this service. When somebody checks a vehicle with us they get the manufacturer's service record and the DVSA MOT history side by side. Aggregated and stripped of anything identifying, that leaves a dataset that can answer the question directly.
How we did it
The naive way to run this comparison is to split cars into "has service records" and "doesn't" and compare failure rates. That produces a headline, and the headline is worthless: cars with retrievable digital records skew heavily towards premium German brands and towards newer vehicles, and newer vehicles pass MOTs. You would be measuring the age of the car and calling it the effect of servicing.
So we did it the other way round. Every vehicle in the analysis has a service record. What varies is timing — whether a given MOT test happened to fall within 12 months of a recorded service, or in a gap. Because the comparison happens inside the same population of cars, brand and buyer type largely cancel out.
Specifically:
- Population. UK vehicles with at least two DVSA MOT tests and at least two recorded service events, sampled from lookups run between March and August 2026.
- Unit of analysis. The individual MOT test, not the car.
- Window restriction. A test only counts if it falls inside the span of the vehicle's service record — between its first and last recorded event. Outside that span, "no service" would just mean the record does not reach that far, which is a data artefact, not an observed gap.
- What counts as a service. Only entries that itemise scheduled maintenance — oil, filters, plugs, brake fluid, inspection, and so on. A dealer's digital record is a list of workshop visits, not a list of services; recalls, warranty repairs, fault investigations and entries with no work listed are excluded. As we found in our coverage research, only about half of all entries are actually scheduled maintenance, and counting them all would badly distort this.
That leaves 3,815 MOT tests on 986 vehicles.
The headline result
| MOT tests where… | Tests | Failed | Advisories per test | Defects per test |
|---|---|---|---|---|
| a dealer service was recorded in the previous 12 months | 2,343 | 11.4% | 0.77 | 0.14 |
| no dealer service was recorded | 1,472 | 14.9% | 0.92 | 0.21 |
A 3.5 percentage-point gap, or a relative reduction of about a quarter. On a two-proportion z-test that is p = 0.002 — unlikely to be chance.
The interesting part: it depends entirely on age
Splitting by vehicle age at the time of the test turns one finding into a much more useful one.
| Age at test | Serviced within 12m | Not serviced | Difference |
|---|---|---|---|
| 0-3 years | 11.5% | 11.8% | none (p = 0.89) |
| 4-9 years | 11.0% | 15.6% | -4.6pp (p = 0.0006) |
| 10+ years | sample too small to publish (131 tests) | ||
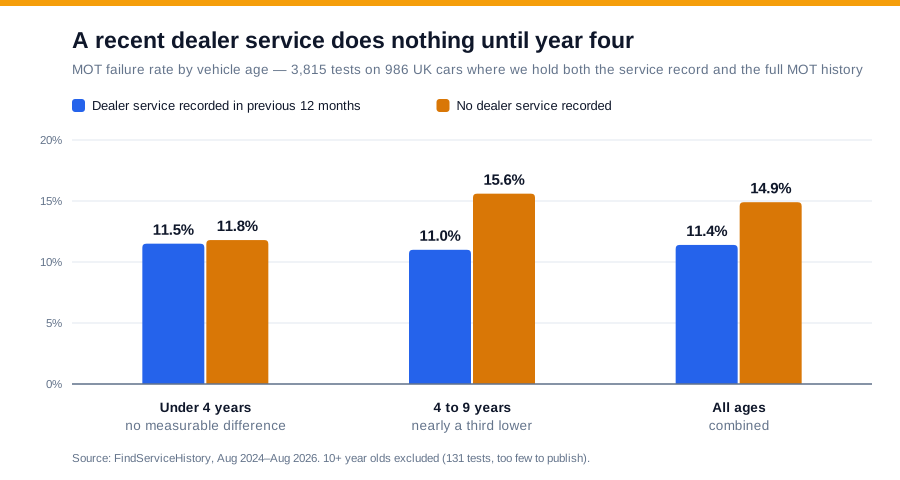
On a car under four, a recent dealer service buys you nothing at MOT time. That is not a criticism of servicing — it is what you would expect. MOT failures are dominated by wear: tyres below 1.6mm, brake pads below 1.5mm, fractured coil springs, worn discs. A three-year-old car has not worn those out yet, and it passes either way.
From year four, that changes. This is the age at which the wear items start reaching their limits, and it is exactly the age at which somebody looking at the car every twelve months starts to matter. The effect is real, it is measurable, and it is worth about a third of the failure risk.
If you are buying a used car, this is the practical takeaway: a gap in the service record of a two-year-old car tells you very little about its condition. The same gap on a seven-year-old car is genuine information.
Where we are less sure
A study that only reports the flattering numbers is not worth citing, so here is the full picture.
We ran a stricter version of the test. Restricting to the 460 vehicles that supply both conditions — cars tested both in a serviced year and in an unserviced year — the gap holds: 12.0% against 15.1% (p = 0.02). But when we collapse that to one observation per car and ask a paired question — did this individual car fail in its unserviced year and pass in its serviced year? — the counts come out at 91 against 84. That is not significant (p = 0.65).
That test is heavily underpowered and mildly biased against the finding, because cars contribute unequal numbers of tests to each condition. But it is the strictest thing we could throw at the result, and it did not confirm it. The honest summary: the association is robust at test level and strongest in the 4-9 year band; a car-level paired test is inconclusive.
Three further caveats matter:
- "No recorded service" is not "no service". Manufacturer records mostly capture franchised-dealer work. A car looked after by a good independent garage appears in this data as unserviced. What we are measuring is the effect of documented main-dealer servicing.
- Owner selection. People who use main dealers may differ from people who don't in ways that also affect MOT outcomes — money, mileage, how they drive. The within-vehicle design reduces this but cannot eliminate it.
- This is our customer base, not the national fleet. People check service history when they are buying, selling or valuing a car. The overall failure rate across all 25,896 tests in our sample is 17.4%, which is well below the national figure — because the cars people pay to research skew newer and more premium than the fleet as a whole. Compare the two groups against each other, not against Britain.
What actually fails an MOT
Separately from the service question, the same dataset gives a clean view of British MOT failures. We classified every defect by its DVSA inspection-manual section code — the reference in brackets at the end of each item — rather than by keyword, so the categories are the DVSA's own.
| Category | Share of failure items | Share of advisories |
|---|---|---|
| Axles, wheels, tyres & suspension | 41.7% | 44.8% |
| Brakes | 18.0% | 23.0% |
| Lamps, reflectors & electrical | 15.2% | 4.1% |
| Visibility | 8.5% | 4.4% |
| Nuisance (emissions, leaks, noise) | 5.9% | 1.8% |
| Body, structure & attachments | 4.2% | 1.4% |
| Steering | 2.8% | 1.6% |
| Other equipment | 2.5% | 0.4% |
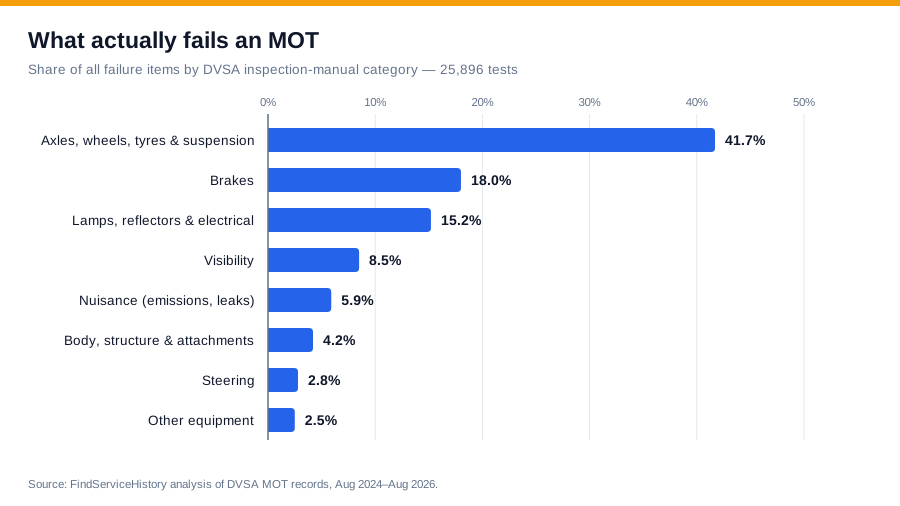
The top five individual defects across the sample, in order: a front tyre below the 1.6mm tread limit (354 occurrences); a rear tyre below the same limit (203); rear brake pads under 1.5mm (172); front brake pads under 1.5mm (169); a front tyre with ply or cords exposed (157).
Every one of the top five is a consumable. None of them is a hidden mechanical fault, and all of them are visible on a forecourt to anyone who looks — which is exactly why they are worth looking at before you buy rather than after.
Advisories are worth reading
An advisory is not a fail, and it is routinely dismissed as noise. It is more predictive than that. We looked at every consecutive pair of tests and asked how often an advisory in one category became a failure in that same category at the next test.
| Advisory category | Instances | Failed same category next test |
|---|---|---|
| Axles, wheels, tyres & suspension | 5,913 | 10.1% |
| Brakes | 3,469 | 5.9% |
| Steering | 295 | 5.8% |
| Lamps, reflectors & electrical | 781 | 5.2% |
| Visibility | 930 | 3.5% |
So roughly nine times in ten, a tyre or suspension advisory is dealt with, or simply does not deteriorate far enough to fail within the year. But one time in ten it is the same car failing on the same thing twelve months later. If you are buying a car whose last MOT carried suspension advisories, that is a bill with a date on it.
Mileage discrepancies rise sharply with age
A car's odometer should only ever go up. A later MOT reading below an earlier one means a rollback, a cloned identity, or — legitimately — a replaced instrument cluster. Counting only drops of more than 1,000 miles, to exclude data-entry noise, 39 of 3,350 vehicles with at least two readings show one: 1.2%, or about one in 86. Where it happens, the median amount erased is 16,634 miles.
That rate is stable — we have now measured it four times on successively larger samples and got 1.4%, 1.4%, 1.2% and 1.2%. What is new here is how sharply it varies with age:
| Vehicle age | Vehicles | With a backwards reading |
|---|---|---|
| Up to 5 years | 528 | 0.2% |
| 6-10 years | 1,934 | 1.0% |
| 11-15 years | 777 | 1.9% |
| 16 years and over | 111 | 2.7% |
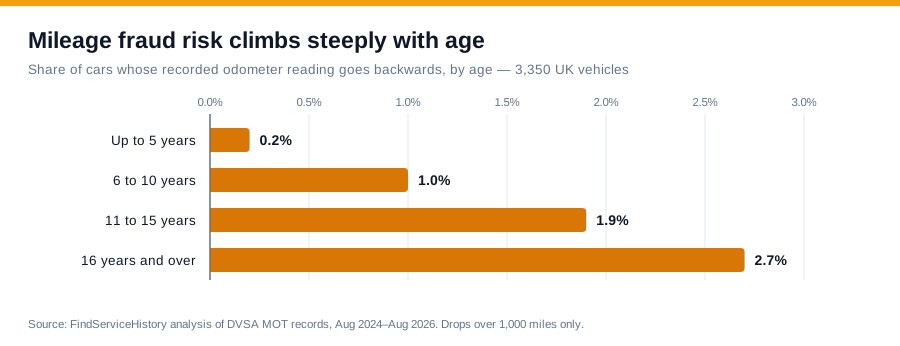
A car over fifteen years old is more than ten times as likely to carry a mileage discrepancy as one under five. That makes sense mechanically: a rollback is worth more on a high-mileage car, and older cars have had more owners and more opportunities. It also means the standard advice to "check the mileage" is far more urgent at the cheap end of the market than at the expensive end.
You can check any UK registration's recorded MOT mileages free on our MOT history checker. It costs nothing and takes about ten seconds.
Method, sample and reuse
Sample. UK vehicle lookups run through FindServiceHistory between March and August 2026 for the original analysis, and through to October 2026 for the re-run above. MOT data is DVSA MOT History; service data is the manufacturer's own digital service record, retrieved by VIN. Vehicles affected by a known provider outage in July 2026 are excluded unless independently re-verified.
Figures. 25,896 MOT tests across 3,350 vehicles for the defect and mileage analysis; 3,815 tests across 986 vehicles for the service-history analysis. Significance by two-proportion z-test. Defect categories are DVSA inspection-manual sections parsed from the defect reference on each item. No personal data, registration or VIN is used in, or recoverable from, any figure published here.
Reuse. Every figure on this page may be quoted freely by journalists, researchers, dealers and forum members with attribution to FindServiceHistory and a link to this page. If you want a cut we haven't published — by brand, by fuel type, by region — ask us. We would rather publish it than have it estimated.
Check a vehicle's service history
Retrieve official manufacturer dealership service records using just a registration number. Results typically arrive within minutes. Your card is authorised but not charged unless we find records.
Run a Service History Check — £9.99No charge unless we find records